How Midterm Elections Affect Stock Market Historically :
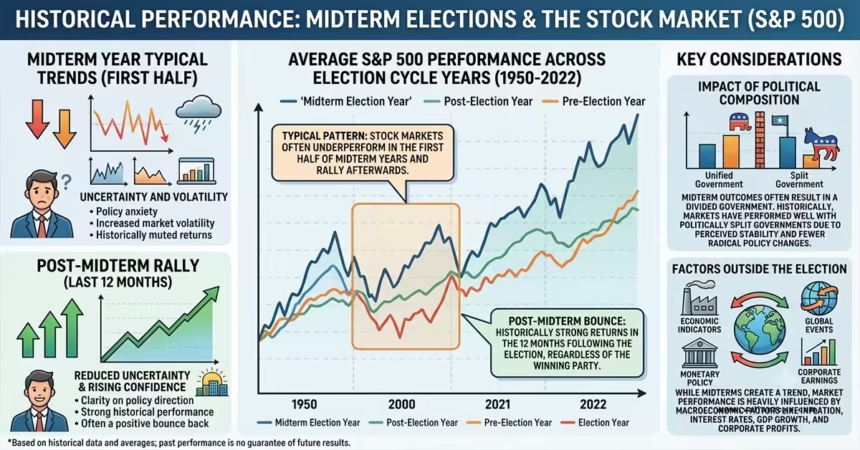
Midterm elections have a clear, repeatable pattern in U.S. equity markets. The uncertainty that builds through the second year of a presidential term often produces choppier trading and deeper intra-year pullbacks. Once the votes are counted, that uncertainty lifts and stocks have historically delivered above-average gains over the following twelve months.
This pattern sits at the heart of the current environment. For a live view of how these historical forces are intersecting with today’s data releases and earnings, see the full breakdown of stock market today November 2026 midterm elections jobs report Apple earnings impact.
The Core Historical Record Since 1950
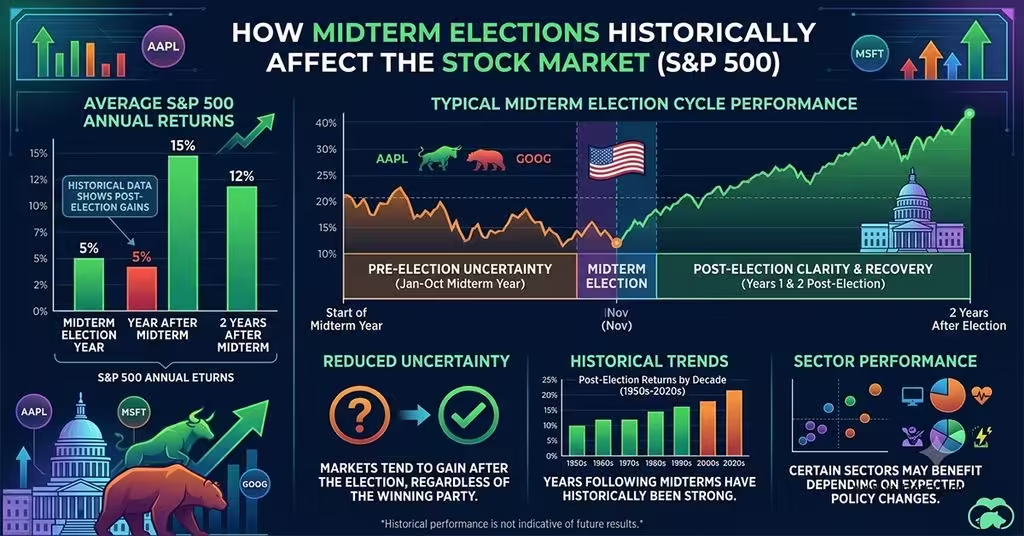
Look at the S&P 500 from Election Day forward across the 19 midterm cycles between 1950 and 2022. The index finished higher twelve months later in every single case. Average gains cluster between 14% and 16%, depending on the exact study and whether dividends are included. Some analyses put the figure near 15%, others closer to 16.6%. The range of outcomes runs from low-single-digit advances (1986) to gains exceeding 30% (1954).
That consistency stands out. Random twelve-month periods since 1950 have produced positive returns roughly three-quarters of the time with average gains nearer 9%. The post-midterm window has been both more reliable and stronger.
The strength often begins before the first ballot is cast. Markets frequently bottom several weeks ahead of Election Day as polling data clarifies likely outcomes. The fourth quarter of midterm years has historically been one of the strongest quarters in the entire four-year presidential cycle.
What Happens in the Midterm Year Itself
Midterm years tend to be the weakest of the presidential cycle. Average calendar-year returns sit in the mid-to-high single digits—well below the long-term average. More telling is the path. Average peak-to-trough drawdowns in midterm years have run near 17%, deeper than in other years of the cycle. Investors dislike open-ended political risk, and midterms deliver plenty of it: questions about control of the House and Senate, potential shifts in tax or regulatory policy, and the usual campaign noise.
Yet most midterm years still end positive. The drawdowns create opportunity for those willing to stay invested through the noise.
Does Party Control Matter?
Less than many expect. Returns in the twelve months after midterms have been positive under unified government, divided government, and shifts in control of either chamber. Some studies show modestly better average performance under gridlock, but the differences are smaller than the overall post-election lift. Markets appear to care more about the removal of uncertainty than about which party holds the gavels.
Sector behavior shows similar consistency. Technology, industrials, and consumer discretionary have often led the post-midterm advance, though leadership rotates with the broader economic backdrop of each cycle.
Volatility and the Relief Rally
Implied volatility usually rises in the weeks leading into midterms and then declines once results become clear. The market treats the election as an event risk. Once that risk is resolved, risk appetite tends to return. This “relief” dynamic helps explain why the strongest gains frequently arrive in the first six months after Election Day.
Longer windows reinforce the pattern. The fifteen months running from October of a midterm year through the following December have produced average S&P 500 returns near 30% since 1950, with every period positive. That stretch captures both the late-year rally and the typically strong third year of the presidential cycle.
Limitations and Caveats
Past performance is not a guarantee. The sample of midterm cycles is finite. Economic conditions, valuation levels, monetary policy, and external shocks have differed widely across those cycles. A market that enters the election near all-time highs with elevated valuations faces a different starting point than one that has already experienced a deep midterm-year decline.
Still, the consistency of the post-election rebound is one of the more durable patterns in modern market history.
Practical Takeaways for Investors
History does not dictate short-term price action, but it does shape probabilities. Elevated pre-election volatility has repeatedly given way to stronger returns once clarity arrives. Investors who treat midterms as a temporary source of noise rather than a permanent regime change have been rewarded more often than not.
Position sizing, time horizon, and the ability to sit through temporary drawdowns matter more than predicting the exact seat count in either chamber. The market has shown a clear preference for resolved political uncertainty over any particular partisan outcome.
The same forces are at work in the current cycle. Understanding the historical baseline helps put today’s price moves, earnings reactions, and data releases into proper context.
Key Takeaways
- Midterm election years have historically been the weakest and most volatile in the four-year presidential cycle. Average S&P 500 returns in midterm years have often lagged (roughly 5–9% in various long-term samples versus higher averages in other years), with deeper average intra-year pullbacks of about 16–17%.
- Stocks have shown a strong and consistent rebound after midterms. Since 1950, the S&P 500 has finished higher 12 months after every midterm election (19 of 19), with average gains commonly cited in the 15–18% range (some samples show ~14–16%).
- The post-election rally frequently begins before Election Day itself (often ~1 month prior) as uncertainty around outcomes fades, and it has occurred regardless of which party gained or lost seats. Long-term market drivers (earnings, rates, economy) matter far more than election results alone.
FAQs
1. Do stocks always rise after midterm elections?
Historically yes in the modern sample: the S&P 500 was higher one year later after all 19 midterms from 1950–2022. Longer histories (back to the 1870s) show positive returns most of the time (~84%), but not 100%. Past patterns are not guarantees.
2. Are midterm years bad for the stock market overall?
They tend to be bumpier with below-average full-year returns and larger drawdowns, but most still finish positive when dividends are included. The weakness is concentrated earlier in the year; the fourth quarter and the following 12 months have often been strong.
3. Does it matter which party wins control of Congress?
Historical data show the post-midterm rally has occurred across different outcomes (unified government, divided Congress, or opposition control). Party control has had limited predictive power compared with broader economic and earnings trends.