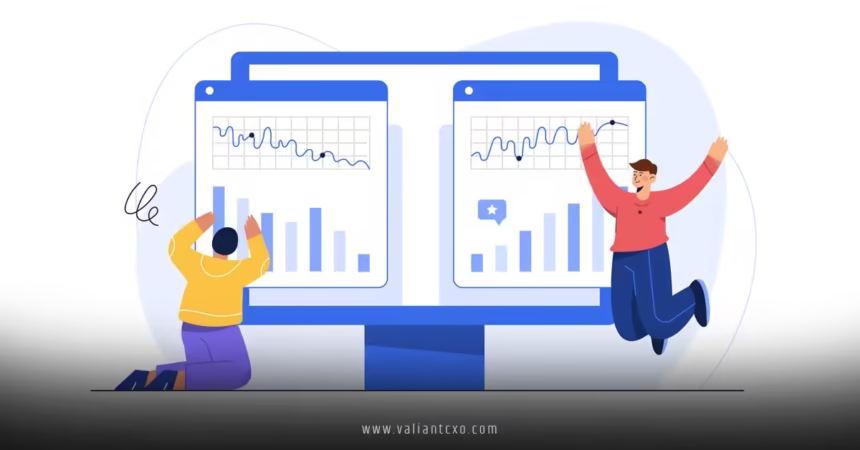
CAC vs LTV analysis for SaaS US is the backbone of any successful software-as-a-service business in the United States. If you’re running a SaaS company, you’ve probably heard these acronyms thrown around like confetti at a parade. But what do they really mean, and why should you care? Let’s dive into the nitty-gritty of Customer Acquisition Cost (CAC) and Lifetime Value (LTV), unravel their importance, and explore how mastering CAC vs LTV analysis for SaaS US can make or break your business. Think of it as a financial tug-of-war: spend too much to acquire customers, and you’re bleeding cash; undervalue your customers’ worth, and you’re leaving money on the table. Ready to find the sweet spot? Let’s go!
What Is CAC vs LTV Analysis for SaaS US?
At its core, CAC vs LTV analysis for SaaS US is about balancing what you spend to gain a customer against the revenue that customer brings over their lifetime. It’s like weighing the cost of planting a tree against the fruit it’ll produce over the years. In the SaaS world, where subscriptions reign supreme, this analysis is your North Star for profitability.
Defining CAC: The Cost of Winning a Customer
Customer Acquisition Cost (CAC) is the total expense of convincing someone to sign up for your SaaS product. This includes marketing campaigns, sales team salaries, ad spend, free trials, and even the coffee your team chugs during late-night strategy sessions. For SaaS companies in the US, CAC can vary wildly—think $500 for a small business tool versus $5,000 for an enterprise solution.
To calculate CAC, divide your total acquisition costs (marketing, sales, tools, etc.) by the number of new customers acquired in a given period. Simple, right? But here’s the kicker: if your CAC is too high, you’re burning through cash faster than a teenager with a new credit card.
Defining LTV: The Value of a Loyal Customer
Lifetime Value (LTV) measures the total revenue a customer generates during their relationship with your SaaS business. Imagine a customer as a piggy bank—every subscription payment adds a coin until they cancel or churn. In the US SaaS market, LTV depends on subscription pricing, retention rates, and how long customers stick around.
To calculate LTV, multiply the average revenue per user (ARPU) by the average customer lifespan (in months or years). For example, if your SaaS charges $100/month and customers stay for 24 months, your LTV is $2,400. The higher the LTV, the more you can justify spending on CAC.
Why CAC vs LTV Analysis for SaaS US Matters
Why obsess over CAC vs LTV analysis for SaaS US? Because it’s the heartbeat of your business’s financial health. A healthy SaaS company aims for an LTV-to-CAC ratio of at least 3:1—meaning your customer’s lifetime value is three times what it costs to acquire them. Anything less, and you’re likely struggling to stay afloat.
This analysis helps you:
- Optimize marketing budgets: Stop throwing money at ineffective campaigns.
- Boost retention: Keep customers longer to maximize LTV.
- Scale smartly: Know when to invest in growth without sinking the ship.
In the competitive US SaaS market, where giants like Salesforce and startups battle for market share, mastering CAC vs LTV analysis for SaaS US is your secret weapon.
How to Calculate CAC vs LTV for SaaS US Businesses
Let’s break down the math behind CAC vs LTV analysis for SaaS US. Don’t worry—I’ll keep it as painless as possible, like ripping off a Band-Aid.
Step 1: Calculating CAC
To nail your CAC, add up all costs related to acquiring customers over a specific period (say, a quarter). Include:
- Ad spend (Google Ads, social media, etc.)
- Marketing and sales team salaries
- Software tools (CRMs, analytics platforms)
- Content creation (blogs, videos, webinars)
Then, divide by the number of new customers acquired in that period. For example:
- Total acquisition costs: $50,000
- New customers: 100
- CAC = $50,000 ÷ 100 = $500
Pro tip: Track CAC by channel (e.g., Google Ads vs. LinkedIn) to see which delivers the best bang for your buck.
Step 2: Calculating LTV
LTV requires three key metrics:
- Average Revenue Per User (ARPU): Your monthly or annual subscription revenue per customer.
- Customer Lifespan: How long customers stay before churning (in months or years).
- Gross Margin: The profit percentage after accounting for costs like hosting or support.
The formula is: LTV = ARPU × Customer Lifespan × Gross Margin
For example:
- ARPU: $100/month
- Lifespan: 24 months
- Gross Margin: 80%
- LTV = $100 × 24 × 0.8 = $1,920
Step 3: The LTV-to-CAC Ratio
Now, divide LTV by CAC. Using the above example:
- LTV: $1,920
- CAC: $500
- LTV-to-CAC = $1,920 ÷ $500 = 3.84
A ratio above 3 is solid, but aim for 4 or higher to give your SaaS business room to grow.
Strategies to Optimize CAC vs LTV Analysis for SaaS US
So, how do you make CAC vs LTV analysis for SaaS US work in your favor? It’s all about lowering CAC, boosting LTV, or both. Here are some battle-tested strategies to tilt the scales.
Lowering CAC: Work Smarter, Not Harder
- Target the Right Audience: Stop casting a wide net. Use data-driven tools like HubSpot to segment your audience and focus on high-intent leads.
- Leverage Organic Channels: Content marketing, SEO, and social media can reduce reliance on paid ads. A well-written blog post can attract customers for years with zero additional cost.
- Optimize Funnels: Streamline your signup process. A clunky user experience is like a leaky bucket—fix it, and you’ll lose fewer prospects.
Boosting LTV: Keep Customers Hooked
- Enhance Onboarding: A smooth onboarding process sets the tone. Use tutorials, webinars, or AI-driven chatbots to help users see value fast.
- Upsell and Cross-Sell: Offer premium features or add-ons to increase ARPU. For example, Slack’s tiered pricing encourages users to upgrade as their teams grow.
- Reduce Churn: Engage customers with regular updates, stellar support, and loyalty perks. Zendesk excels at this by offering 24/7 support to keep users happy.
Balancing the Equation
The magic happens when you lower CAC and raise LTV simultaneously. It’s like tuning a guitar—get the balance right, and the music flows. Run A/B tests on ad campaigns, refine your pricing model, and listen to customer feedback to find the perfect harmony.
Common Pitfalls in CAC vs LTV Analysis for SaaS US
Even the best SaaS founders can stumble. Here are some traps to avoid in your CAC vs LTV analysis for SaaS US.
Overlooking Hidden Costs
CAC isn’t just ads and salaries. Forgetting costs like software subscriptions or contractor fees can skew your numbers. Be thorough—every dollar counts.
Ignoring Churn
High churn kills LTV faster than you can say “unsubscribe.” If customers leave after a few months, your LTV plummets. Monitor churn rates and address pain points pronto.
Misjudging Scalability
A low CAC might look great, but if it’s tied to a channel that doesn’t scale (like a niche influencer campaign), you’ll hit a wall. Plan for growth with scalable strategies like SEO or partnerships.
Real-World Examples of CAC vs LTV Analysis for SaaS US
Let’s bring this to life with a couple of hypothetical SaaS companies in the US.
Case Study 1: CloudSync, a File-Sharing SaaS
CloudSync spends $10,000 monthly on Google Ads and content marketing, acquiring 50 new customers. Their CAC is $200. With an ARPU of $50/month, a 30-month lifespan, and a 75% gross margin, their LTV is:
- LTV = $50 × 30 × 0.75 = $1,125
- LTV-to-CAC = $1,125 ÷ $200 = 5.63
CloudSync’s ratio is stellar, giving them room to scale aggressively. They reinvest profits into SEO to lower CAC further.
Case Study 2: TaskPro, a Project Management SaaS
TaskPro spends $20,000 to acquire 25 customers, resulting in a CAC of $800. Their ARPU is $150/month, but high churn means a 12-month lifespan and a 70% margin. Their LTV is:
- LTV = $150 × 12 × 0.7 = $1,260
- LTV-to-CAC = $1,260 ÷ $800 = 1.58
TaskPro’s ratio is dangerously low. They need to reduce churn or lower CAC to stay profitable.
Tools to Simplify CAC vs LTV Analysis for SaaS US
Thankfully, you don’t have to crunch numbers on a napkin. Tools like Baremetrics provide real-time CAC and LTV insights. Other options include:
- Google Analytics: Track acquisition costs by channel.
- Mixpanel: Analyze user behavior to improve retention.
- ProfitWell: Free LTV and CAC dashboards tailored for SaaS.
These tools make CAC vs LTV analysis for SaaS US as easy as pie—without the calories.
Conclusion: Mastering CAC vs LTV Analysis for SaaS US
CAC vs LTV analysis for SaaS US isn’t just a buzzword—it’s your roadmap to sustainable growth. By keeping CAC low and LTV high, you ensure your SaaS business thrives in the competitive US market. Start by calculating your metrics accurately, then optimize with targeted marketing, stellar onboarding, and churn-busting strategies. Avoid pitfalls like hidden costs or high churn, and leverage tools to stay ahead of the curve. Ready to take your SaaS to the next level? Dive into CAC vs LTV analysis for SaaS US today, and watch your profits soar!
FAQs
1. What is the ideal LTV-to-CAC ratio for CAC vs LTV analysis for SaaS US?
The ideal LTV-to-CAC ratio is 3:1 or higher. This means your customer’s lifetime value should be at least three times the cost to acquire them, ensuring profitability and room for growth.
2. How can I reduce CAC in my SaaS business?
To lower CAC, focus on organic channels like SEO, refine your targeting to high-intent leads, and streamline your sales funnel to convert more prospects efficiently.
3. Why is churn a big deal in CAC vs LTV analysis for SaaS US?
High churn shortens customer lifespan, slashing LTV. Reducing churn through better onboarding and support can significantly boost your LTV-to-CAC ratio.
4. What tools help with CAC vs LTV analysis for SaaS US?
Tools like Baremetrics, ProfitWell, and Mixpanel provide real-time insights into CAC, LTV, and churn, making it easier to optimize your SaaS metrics.
5. How often should I perform CAC vs LTV analysis for SaaS US?
Review your CAC and LTV monthly or quarterly to spot trends, adjust marketing strategies, and ensure your business stays on a profitable path.
Read Also:valiantcxo.com