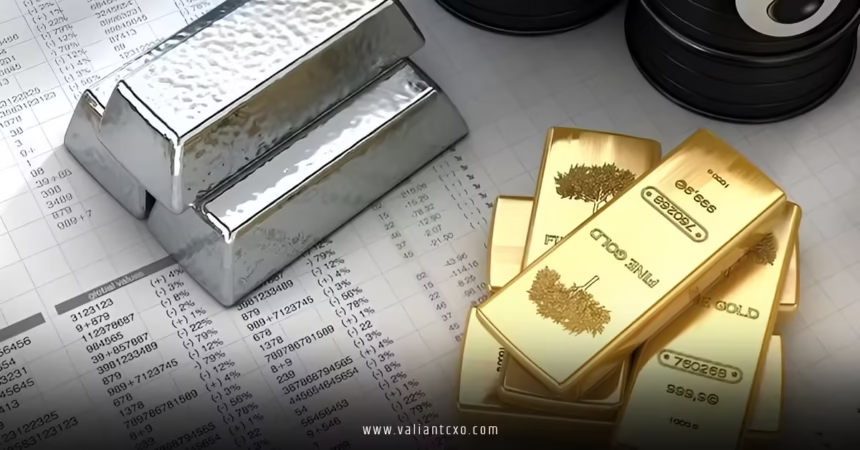
Gold silver ratio forecast 2026 is capturing massive attention from investors as we close out an extraordinary 2025. Picture this: gold has soared over 70% to around $4,500 per ounce, while silver has exploded with gains exceeding 140-150%, pushing prices toward $75-$79 per ounce. That dramatic outperformance has compressed the gold-silver ratio sharply—from highs above 100:1 earlier in the year down to roughly 60-65:1 by late December. So, what’s next? Will the gold silver ratio forecast 2026 show further compression, signaling even more silver strength, or could it rebound? Let’s unpack this key indicator and explore why it’s a game-changer for precious metals enthusiasts.
The gold-silver ratio—simply the price of gold divided by the price of silver—tells us how many ounces of silver it takes to buy one ounce of gold. Historically, it’s fluctuated wildly, but understanding its movements can help spot opportunities. In bull markets for precious metals, a falling ratio often means silver is catching fire. With industrial demand roaring and supply tight, the gold silver ratio forecast 2026 could point to exciting shifts ahead.
What Is the Gold-Silver Ratio and Why Does It Matter?
Ever wondered why some investors obsess over this simple division? The gold-silver ratio acts like a thermometer for relative strength between the two metals. A high ratio (say, above 80:1) suggests silver is undervalued compared to gold—time to consider swapping gold for silver. Conversely, a low ratio (below 50:1) might mean silver has run too hot.
Why care about the gold silver ratio forecast 2026? Because it influences trading strategies, portfolio allocation, and even hints at broader market sentiment. Gold thrives as a pure safe-haven, while silver’s industrial side makes it more volatile—like a sports car versus gold’s steady luxury sedan. In 2025, silver’s industrial boom in solar, EVs, and AI has driven the ratio lower, rewarding those who bet on compression.
Current State of the Gold-Silver Ratio Entering 2026
As of late December 2025, the gold-silver ratio hovers around 60-65:1. That’s a stunning drop from April’s peak near 105:1 and even from mid-year levels above 90:1. Silver’s parabolic surge—up over 140% year-to-date—has been the main culprit, outpacing gold’s impressive 70% gain.
Think of it this way: early in 2025, it took over 100 ounces of silver to match one gold ounce. Now, it’s closer to 65. This compression mirrors classic bull market patterns, where silver plays catch-up and then accelerates. But is this the new normal, or just a temporary swing? The gold silver ratio forecast 2026 will hinge on whether silver’s momentum holds.
Historical Trends in the Gold-Silver Ratio
History offers clues. Over centuries, the ratio has averaged 40-60:1 in many eras, though modern times pushed it higher—often 60-80:1 due to gold’s safe-haven dominance. Spikes above 100:1, like in 2020 or early 2025, have historically preceded silver rallies as the ratio mean-reverts.
In strong precious metals bulls, the ratio plunges: dropping below 50:1 signals silver mania. We’ve seen this in past cycles, and 2025’s sharp decline from 100+:1 echoes those setups. Rhetorical question: if history rhymes, could the gold silver ratio forecast 2026 see it test 50:1 or lower?
Key Drivers Shaping Gold Silver Ratio Forecast 2026
Several forces are at play. Let’s break them down.
Silver’s Industrial Demand Explosion
Silver isn’t just jewelry or coins—over 50% goes to industry. Solar panels, electric vehicles, and AI data centers are devouring it, with demand projected to top 200 million ounces annually soon. This “price-insensitive” buying supports silver even at highs.
Gold? Mostly monetary. So, when green tech booms, silver pulls ahead, compressing the ratio. Expect this tailwind in the gold silver ratio forecast 2026.
Supply Deficits and Mining Challenges
Persistent deficits—five years running—have drained stockpiles. New mines lag, and recycling can’t fill the gap. Tight supply favors silver upside, narrowing the ratio further.
Macro Factors: Rates, Dollar, and Geopolitics
Lower rates in 2026 could weaken the dollar, boosting both metals—but silver’s leverage amplifies gains. Geopolitical risks keep gold strong, but if resolved, silver’s industrial edge shines.
Expert Predictions for Gold Silver Ratio Forecast 2026
Analysts are mostly bullish on compression. Conservative views see the ratio drifting to 70-75:1 if gold hits $4,800-$5,000 while silver averages $65-$80. Optimists eye 50-60:1 or lower, implying silver at $90-$110 if gold reaches similar targets.
Retail sentiment? Over half in surveys bet on silver outperforming again, pushing the ratio below 60:1. Tie this to our earlier discussion on silver futures price forecast 2026—many see $80-$100 silver, supporting deeper compression.
Why the optimism? Structural deficits and demand growth tilt toward silver leadership in the gold silver ratio forecast 2026.
How the Gold-Silver Ratio Ties to Silver Futures Price Forecast 2026
Speaking of which, the ratio directly impacts silver outlook. Further compression means silver gains more percentage-wise. For deeper dives into silver’s potential, check our comprehensive silver futures price forecast 2026.
Risks to the Gold Silver Ratio Forecast 2026
Nothing’s certain. An economic slowdown could crimp industrial demand, widening the ratio. High prices might spur substitution or recycling. If gold surges on crisis while silver lags, the ratio rebounds.
Volatility is silver’s hallmark—big swings possible. Always diversify.
Strategies Using Gold Silver Ratio Forecast 2026
Traders often “trade the ratio”: buy silver/sell gold when high, reverse when low. Long-term holders might accumulate silver now, anticipating compression.
For insights, visit authoritative sources like the Silver Institute, Kitco, or Investing.com.
Conclusion
In summary, the gold silver ratio forecast 2026 leans toward further compression, potentially to 50-70:1, driven by silver’s industrial supremacy and ongoing deficits. From current 60-65:1 levels, this implies robust silver outperformance amid a supportive precious metals backdrop. Risks like demand slowdowns exist, but fundamentals favor the white metal shining brighter.
Ready to navigate this? Monitoring the ratio could unlock opportunities—whether holding physical, ETFs, or futures. With 2026 shaping up as another dynamic year, stay vigilant and position accordingly. The shine might just be getting started.
FAQs
1. What is the expected range for gold silver ratio forecast 2026?
Most experts anticipate 60-75:1, with bullish scenarios dipping below 60:1 if silver continues outperforming on industrial demand.
2. How does industrial demand affect the gold silver ratio forecast 2026?
Booming sectors like solar and EVs boost silver consumption, often leading to ratio compression as silver prices rise faster than gold’s.
3. Could the gold-silver ratio rebound in 2026?
Yes, if economic weakness hits industrial offtake or gold surges as a safe-haven, potentially pushing the ratio back toward 80:1.
4. Why link gold silver ratio forecast 2026 to silver futures?
The ratio signals relative value; compression supports higher silver prices—explore more in silver futures price forecast 2026.
5. Is now a good time to trade based on gold silver ratio forecast 2026?
At current compressed levels, some see value in gold, but ongoing trends favor watching for further silver strength.