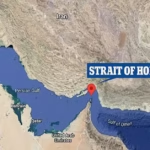
Strait of Hormuz oil traffic today sits at the center of every energy conversation in 2026.
Here’s the quick snapshot:
- Roughly 13 million barrels per day of crude and products moved through the waterway in the most recent weekly average, according to ship-tracking firm Kpler—about 77-80% of the pre-February 2026 baseline.
- Total Middle East crude exports (Hormuz plus pipelines and bypass ports) have climbed to nearly 13 million barrels a day, the strongest month since the conflict began.
- Tankers still rely on U.S. Navy escorts, dark sailing, and ship-to-ship transfers outside the Gulf.
- Normal commercial traffic remains heavily restricted; insurance costs stay elevated and attacks, while less frequent, have not stopped.
- Asian buyers, especially China and India, continue to take the bulk of the volume that clears the strait.
Strait of Hormuz oil traffic today is the single most watched number in global energy markets. One narrow waterway—barely 21 nautical miles at its tightest—still carries the fate of gasoline prices at U.S. pumps, jet-fuel costs for airlines, and the operating budgets of every Asian refinery that runs on Gulf crude.
Before the fighting that started at the end of February 2026, the strait routinely handled 17 to 20 million barrels a day of crude and products, plus a major share of Qatar’s LNG. That was roughly one-fifth of the world’s daily petroleum liquids consumption. When Iran effectively choked the corridor, volumes collapsed. What we are seeing now is a hard-fought, expensive recovery, not a return to business as usual.
What the Latest Numbers Actually Show
Different trackers publish different figures because many tankers sail with AIS transponders switched off and because cargoes get transferred between ships outside the Gulf. The range that matters right now looks like this:
Kpler’s seven-day average through late September put oil and product flows through the strait at 13.1 million barrels a day. September monthly averages for the waterway itself sit lower—around 7.4 to 10 million barrels depending on the firm—while total regional crude exports (including Saudi Arabia’s East-West pipeline to Yanbu and the UAE’s Fujairah route) have reached roughly 12.8–13 million barrels a day.
That puts the system at about 70-80% of the pre-war regional total. Saudi Arabia has driven much of the recent rebound, shifting more volume back onto Gulf terminals after a drone strike hit its Red Sea pipeline in early September.
| Metric | Pre-War Baseline | Late September 2026 | Notes |
|---|---|---|---|
| Strait of Hormuz oil/products flow | 17–20 million b/d | ~13.1 million b/d (weekly avg) | Kpler data; still relies on escorts and dark transits |
| Total Gulf crude exports (all routes) | ~19 million b/d | ~12.8–13 million b/d | Highest monthly average since February |
| Saudi share of Hormuz traffic | Dominant | Surged after pipeline disruption | Kingdom now accounts for a large portion of visible Hormuz volume |
| Vessel transits (all types) | ~130–140 per day | Far lower; many dark or escorted | AIS undercounts actual movements |
| LNG component | Significant Qatari volumes | Recovering but still constrained | Less public data than crude |
These are not theoretical numbers. They come from commercial trackers that feed the same desks that price Brent and WTI.
Why Strait of Hormuz Oil Traffic Today Still Moves Markets
Think of the strait as the only highway exit from a massive industrial park. Saudi Arabia, Iraq, Kuwait, the UAE, Qatar, and Iran all load most of their export crude inside the Persian Gulf. Pipelines can carry only a few million barrels a day around the bottleneck. Everything else has to squeeze through those two-mile-wide shipping lanes.
When volume drops, Asian refiners scramble, freight rates spike, and the risk premium in oil prices stays elevated. U.S. drivers feel it at the pump even though American crude production remains high; global benchmarks still set the tone.
In my experience watching these chokepoints, the market does not wait for perfect data. It reacts to direction. A sustained climb above 13–14 million barrels a day through the strait tends to ease the risk premium. A sudden drop below 8 million barrels a day lights the fuse again.

Step-by-Step: How to Track Strait of Hormuz Oil Traffic Today Yourself
You do not need a Bloomberg terminal. Here’s the practical routine I recommend for anyone who needs a reliable weekly read:
- Start with the U.S. Energy Information Administration’s chokepoint page and the International Energy Agency’s oil-market reports. They publish the baseline historical volumes and the official context.
- Cross-check with commercial tracker summaries that appear in major outlets (Kpler numbers frequently surface in The New York Times and Wall Street Journal coverage).
- Watch for weekly rolling averages rather than single-day spikes. Convoy days produce temporary surges that do not represent sustainable flow.
- Note the split between crude and products. Refined-product volumes have recovered more slowly than crude because of refinery damage and higher insurance hurdles.
- Factor in the bypass routes. Saudi East-West pipeline loadings and UAE Fujairah volumes matter almost as much as pure Hormuz transits right now.
- Scan maritime security advisories from UKMTO or the Joint Maritime Information Center for attack reports. One confirmed strike can push freight and insurance higher overnight.
Strait of Hormuz oil traffic today Do this once a week and you will stay ahead of most headline noise.
Common Mistakes & How to Fix Them
Mistake 1: Treating every AIS-visible count as the full story.
Many tankers run dark. Fix: Look for satellite-derived or cargo-loading estimates from the major trackers instead of pure AIS maps.
Mistake 2: Confusing strait flow with total regional exports.
Pipelines and Fujairah still move millions of barrels. Fix: Always check the combined figure.
Mistake 3: Assuming a single daily number equals the trend.
Convoy operations create big one-day jumps. Fix: Use seven-day or monthly averages.
Mistake 4: Ignoring insurance and freight costs.
Even when physical volume recovers, the economics remain painful. Fix: Track dirty tanker rates on the AG–Asia routes as a reality check.
Mistake 5: Expecting a clean return to 2025 normal.
The security environment has changed. Fix: Treat 80% recovery as a major operational success, not a failure.
What the Recovery Actually Looks Like on the Water
Strait of Hormuz oil traffic today Tankers load inside the Gulf, sail under naval escort or with transponders off, then transfer cargo to larger vessels waiting in the Gulf of Oman. That shuttle system is expensive and slow, but it works. Saudi Arabia’s recent pivot back toward Gulf terminals after the East-West pipeline attack shows how quickly producers will use the strait when the alternative route gets hit.
Iran still claims authority over the waterway and has continued intermittent attacks. The U.S. naval presence has made those attacks costlier and less effective. The net result is that Tehran’s leverage has eroded even while the threat remains real.
Key Takeaways
- Strait of Hormuz oil traffic today is running near 13 million barrels a day on a weekly basis—roughly 80% of the pre-war strait baseline.
- Total Middle East crude exports including bypasses have reached their highest level since February 2026.
- Recovery depends on military escorts, dark sailing, and ship-to-ship transfers rather than open commercial navigation.
- Saudi Arabia has shifted significant volume back onto Hormuz routes after Red Sea pipeline disruption.
- Asian demand, especially from China and India, continues to absorb most of the barrels that clear the strait.
- Risk remains elevated; insurance and freight costs have not returned to normal.
- Weekly averages matter more than single-day spikes for anyone trying to read the market.
- Pipeline capacity around the strait is limited, so sustained Hormuz flow is still essential for global supply balance.
Strait of Hormuz oil traffic today Stay focused on the direction of the weekly averages and the security advisories. Those two data points tell you more about the next move in oil prices than any single headline. If you follow energy markets for a living or simply want to understand why your fuel bill moves, make the weekly check on Strait of Hormuz oil traffic today part of your routine.
FAQs
What is the current daily volume for Strait of Hormuz oil traffic today?
The most recent weekly averages from major trackers put oil and petroleum product flows through the strait near 13 million barrels a day, roughly 77-80% of the pre-war level for that corridor.
Why does Strait of Hormuz oil traffic today still affect U.S. gasoline prices?
Global oil benchmarks react to Gulf supply risk. Even though the United States produces large volumes of its own crude, the risk premium that builds when the strait is constrained shows up in product prices worldwide.
Has normal commercial shipping returned to the Strait of Hormuz?
No. Most current traffic still relies on naval protection, dark sailing, or shuttle operations. Open commercial transit remains limited and expensive.