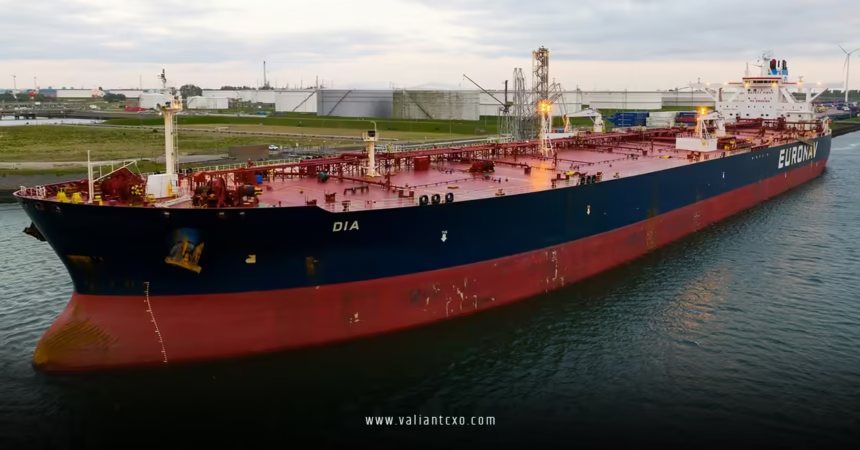
Oil tanker freight rates 2026 are holding strong amid geopolitical shifts, longer voyage distances, and tight vessel supply. Rates surged well above 10-year averages in late 2025, with VLCC earnings occasionally topping $100,000 per day.
Expect volatility. Sanctions on Russia, Iran, and Venezuela keep pushing cargoes onto longer routes. New tanker deliveries could ease pressure later in the year, but early 2026 looks bullish for owners.
- What they are: Daily hire rates or voyage costs for ships hauling crude oil. Key segments include VLCCs (Very Large Crude Carriers, ~2 million barrels), Suezmax (~1 million barrels), and Aframax (smaller, flexible routes).
- Why they matter in 2026: Higher rates ripple into gasoline prices at the pump, refinery margins, and global energy costs. For traders, shippers, and investors, they signal supply chain stress.
- Current pulse: Spot rates remain elevated versus historical norms, driven by tonne-mile demand from redirected flows.
- USA angle: Gulf Coast exports and imports feel the impact directly through routes to Europe and Asia.
Oil tanker freight rates 2026 won’t crash anytime soon. The market’s tight, and disruptions keep vessels busy.
What Drives Oil Tanker Freight Rates 2026?
Supply and demand rule here. Oil production grows, but geography and politics stretch voyages. Think of it like rush-hour traffic on a highway with half the lanes closed—same cars, way more time on the road.
Key factors:
- Geopolitics and sanctions remove “shadow fleet” vessels from mainstream trade, tightening available tonnage.
- Longer routes from Middle East to Asia or rerouted Russian crude boost tonne-miles.
- OPEC+ decisions and non-OPEC supply growth (U.S., Brazil, Guyana) influence cargo volumes.
- Fleet age and slow newbuilding deliveries early in the year support rates.
Rates fluctuate wildly. One week a VLCC from the Persian Gulf to China might command premium figures; the next, seasonal dips hit. Here’s the thing: what looks like noise often ties back to real-time events in the Strait of Hormuz or Red Sea ripples.
Vessel Types and Typical Rates in 2026
Different ships serve different trades. VLCCs dominate long-haul. Suezmaxes handle medium distances and Suez Canal transits. Aframaxes offer flexibility for shorter or restricted ports.
2026 Rate Snapshot (Approximate Daily Averages / Spot Indicators):
| Vessel Type | Capacity (DWT) | Typical Routes | Est. Daily Rate Range (Early 2026) | Notes |
|---|---|---|---|---|
| VLCC | 200,000–320,000 | MEG-China, USGC-Asia | $80,000–$140,000+ | Long-haul king; peaks over $100k common in 2025 carryover |
| Suezmax | 120,000–200,000 | West Africa-Europe, Black Sea-Med | $45,000–$100,000+ | Flexible; benefits from VLCC spillover |
| Aframax | 80,000–120,000 | Regional (Med, Caribbean-USGC) | $40,000–$80,000 | Shorter routes; more volatile |
Data synthesized from industry reports like Fearnleys, Argus, and EIA. Actuals vary by route, season, and fixtures.
Rates often quoted in Worldscale (WS) points or Time Charter Equivalent (TCE). High WS means strong earnings.
Oil Tanker Freight Rates 2026 Outlook: Bullish Early, Cautious Later
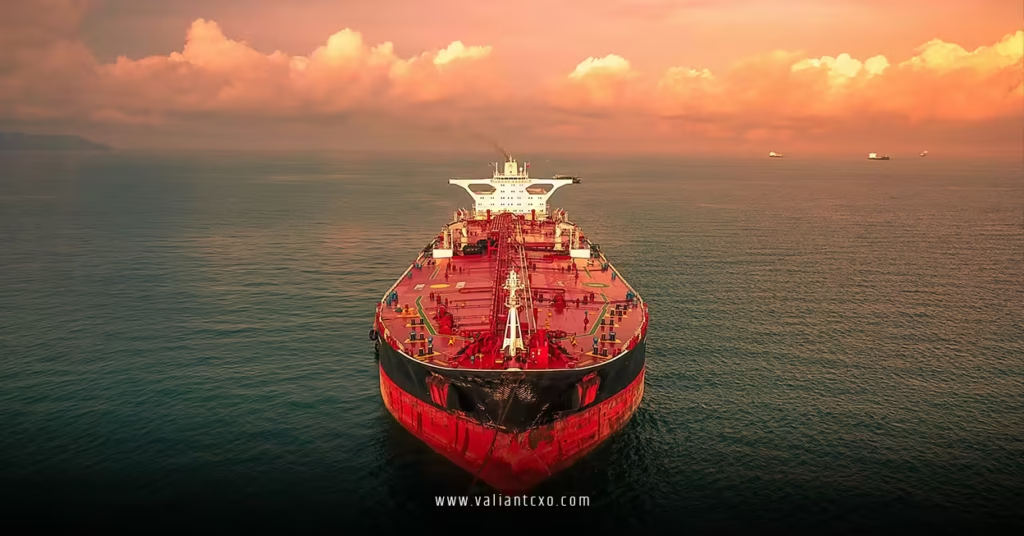
The first half of 2026 stays firm. Sanctions keep effective supply tight. Tonne-mile demand from shifting trades supports owners.
Later in the year? More newbuildings hit the water. Rates may moderate but unlikely to collapse to 10-year averages. Product tankers face more pressure from faster fleet growth.
What I’d watch if I were trading or chartering: OPEC+ production cuts unwinding, U.S. Gulf exports, and any easing of sanctions on Venezuela or Iran. One sharp escalation in the Middle East could send rates parabolic again.
Step-by-Step: How Beginners Can Track and Understand Oil Tanker Freight Rates 2026
Don’t get overwhelmed. Start simple.
- Learn the basics: Read up on vessel classes and Worldscale system. Free resources from Baltic Exchange help.
- Follow key indices: Check Baltic Dirty Tanker Index or Argus assessments for daily moves.
- Use free/public tools: EIA reports for U.S.-focused insights. Vortexa or Kpler for flow data (paid but powerful).
- Monitor news triggers: Sanctions announcements, OPEC meetings, and chokepoint disruptions move markets fast.
- Build a simple dashboard: Track VLCC TCE rates on major routes alongside crude prices.
- Practice with historical data: See how rates reacted to past events like Red Sea issues.
Pro tip: Paper trade a few fixtures. Nothing beats seeing your assumptions tested by real volatility.
Common Mistakes & How to Fix Them
Newcomers often treat rates like stock prices—pure speculation. Wrong. They’re driven by physical supply chains.
- Mistake: Ignoring route specifics. A strong MEG-China VLCC rate doesn’t mean all tankers boom. Fix: Always map the cargo origin to destination.
- Mistake: Chasing headlines without context. One geopolitical tweet spikes fear. Fix: Cross-check with tonnage lists and fixture reports.
- Mistake: Forgetting bunker fuel and operating costs. High gross rates can mask slim margins. Fix: Calculate TCE (Time Charter Equivalent) net of expenses.
- Mistake: Over-relying on forecasts. Markets shift quick. Fix: Build scenarios—bull, base, bear—and size positions accordingly.
In my experience, the folks who win long-term respect the physical reality over spreadsheet models.
Oil Tanker Freight Rates 2026: Risk Management for Shippers and Traders
USA-based refiners and exporters face direct exposure. Lock in time charters during dips if you need certainty. Diversify routes. Build relationships with reliable brokers.
For investors eyeing tanker stocks or ETFs, strong rates lift earnings but capex on scrubbers and newbuildings eats into cash flow. Watch fleet utilization above 90% as a bullish signal.
Key Takeaways
- Oil tanker freight rates 2026 opened strong thanks to geopolitics and tight supply.
- VLCCs lead the charge on long hauls; mid-size vessels benefit from spillover.
- Sanctions and longer voyages are the dominant theme—expect volatility.
- Early year strength likely, with moderation possible in H2 as new tonnage arrives.
- Beginners should focus on major routes, indices, and physical fundamentals.
- Rates directly impact U.S. energy costs and global trade efficiency.
- Always separate facts from speculation; attribute moves to verifiable drivers.
- The market rewards patience and real-time monitoring over panic.
Bottom line: Smart players who grasp the physical drivers behind oil tanker freight rates 2026 will navigate this market profitably. Start tracking those key routes today. Check the latest fixtures, run your scenarios, and stay nimble. The next disruption is always around the corner—be ready.
FAQs
How do geopolitical events specifically impact oil tanker freight rates 2026?
Sanctions sideline vessels and force longer detours, spiking tonne-mile demand and rates. Conflicts near chokepoints like Hormuz add war risk premiums and delays.
What’s the difference between spot rates and time charter rates for oil tankers in 2026?
Spot rates cover single voyages and swing wildly with immediate supply/demand. Time charters lock in daily hire for months or years, offering stability for owners and predictability for charterers.
Are oil tanker freight rates 2026 a good indicator for U.S. gasoline prices?
Indirectly yes. Higher freight costs raise delivered crude prices for refiners, which can flow through to pump prices, especially during tight supply periods.