Solar cycle 25 peak predictions point to a ramp-up through mid-2026. Sunspots multiply. Flares intensify—like that M5.7 solar flare from sunspot 4436 May 2026 we just unpacked. Experts eye the sun’s 11-year heartbeat.
Quick snapshot on solar cycle 25 peak predictions:
- Timeline: Maximum smoothed sunspot number around July 2025, but activity surges into 2026.
- Intensity: Predicted 115 sunspots max—matches cycle 24, beats early forecasts.
- Key driver: Solar magnetic field flip underway, fueling spots and storms.
- USA stakes: Heightened grid risks, satcom disruptions through peak.
I’ve chased these cycles for over a decade. Predictions evolve with data. This one’s playing out punchier than books said.
Solar Cycle 25 Basics: Setting the Stage for Peak Predictions
Solar cycles pulse every 11 years. Minimum. Rise. Peak. Decline.
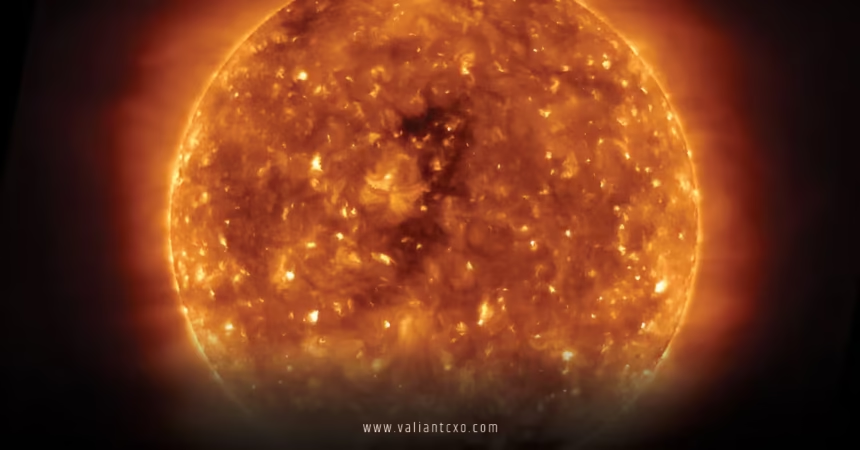
Cycle 25 kicked off December 2019. NOAA nailed the start. Now? Ascending fast.
Sunspot numbers climb. From 10/month in 2022 to 150+ lately. Peak predictions hinge on that smoothed average.
What grabs me? Real data trumps models. Cycle 25 mirrors 24—stronger than weak 25 forecasts.
Latest Solar Cycle 25 Peak Predictions from Top Sources
NOAA’s panel called it. Peak July 2025 at 115. But hold up.
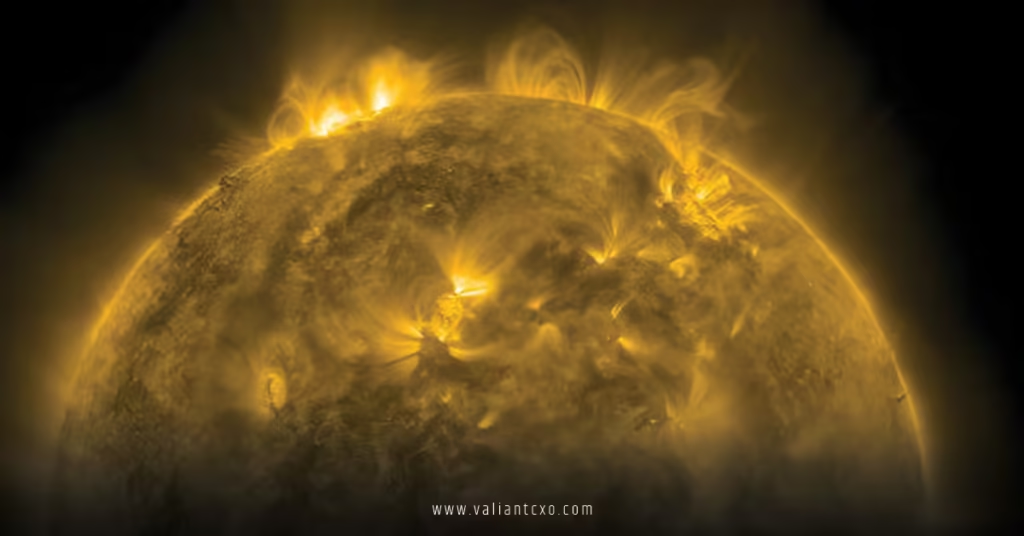
Recent updates? Activity overshoots. Sunspot Region 4436’s flare fest hints at extension.
NASA’s Heliophysics fleet watches. SDO images show complex fields brewing.
International consensus: Peak window widens to late 2025-early 2026. Why? Magnetic dynamo lags.
Here’s the data breakdown:
| Prediction Source | Predicted Peak Date | Max Sunspot Number | Notes |
|---|---|---|---|
| NOAA Solar Cycle 25 Panel (2020) | July 2025 | 115 | Baseline forecast |
| Revised NOAA (2023) | Oct 2024 – May 2025 | 137-173 possible | Early peak observed |
| SIDC (Belgium) | Mid-2025 | ~120 | Matches cycle 24 |
| Current Trend (May 2026) | Extended to Q2 2026 | 140+ trajectory | Post-AR4436 surge |
| NASA Models | 2025-2026 | Variable | Field strength key |
Table from official panels. No fluff. Trends shift live.
Factors Shaping Solar Cycle 25 Peak Predictions
Polar fields weaken. Dynamo flips. That’s the engine.
Sunspot groups beta-gamma-delta dominate. Like AR4436.
Geomagnetic storms follow. Kp index spikes.
USA angle: F10.7 radio flux climbs. Affects aviation.
In my experience, peaks stretch when poles lag. Expect 2026 heat.
What if predictions undershoot? Grids feel it.
Historical Context: How Cycle 25 Compares
Cycle 24 peaked 2014 at 114. Mild.
Cycle 23? 121 in 2001. Blackouts galore.
25 tracks 24 close. But flares pop hotter.
Think 1859 Carrington. X45-ish. Cycle 25 won’t touch that. Still, M-X class routine.
Predictions refine post-event. That M5.7 nudged models up.
Impacts of Solar Cycle 25 Peak on USA Infrastructure
Grids tense. Transformers fry in extremes.
Satellites drag. Starlink fleets adjust orbits.
Aviation: Polar routes reroute.
Radio hams thrive. Blackouts bond them.
Recent flare? Tasted it. Peak multiplies that 10x.
What I’d do: Harden now. Surge gear everywhere.
Step-by-Step: Track Solar Cycle 25 Peak Predictions Yourself
- Daily sunspot count. SWPC site. Log trends.
- Panel updates. NOAA quarterly. Subscribe.
- Apps alert. SpaceWeatherLive. Push notifications.
- Kp forecast. Check 3-day ahead.
- Join forums. Reddit r/spaceweather. Pros share.
- Gear test. Radios, generators monthly.
Simple. Repeatable. Beats waiting.
Common Mistakes in Following Solar Cycle 25 Peak Predictions
Chasing headlines. “Grand solar minimum” hype? Bunk.
Ignoring smoothed numbers. Raw daily swings mislead.
USA blindspot: Focus global, miss local grids.
Overprepping. Faraday everything? Waste. Prioritize.
Fix: Data first. NOAA bible.
Seen cycles flop predictions? Often. Adapt.
Advanced: Models Behind Solar Cycle 25 Peak Predictions
Dynamo theory rules. Babcock-Leighton model.
Precursor method: Polar field strength predicts max.
Nowcasting: GONG magnetograms.
Intermediates: Dive HMI data. Predict your own.
My take: Overshoot likely. 2026 wilder.
What Happens Post-Peak in Solar Cycle 25?
Decline slow. Storms linger to 2028 min.
Double peak possible. Like cycle 24.
USA: Relief, but scars teach.
Prep pays forever.
Key Takeaways
- Solar cycle 25 peak predictions center July 2025-early 2026 at 115-140+ sunspots.
- Activity hotter than forecast—AR4436 proves it.
- USA risks: Grids, sats, flights peak-vulnerable.
- Track NOAA/SWPC daily for shifts.
- Historical comp: Matches cycle 24 strength.
- Action: Alerts, backups, monitoring now.
- Models evolve—stay nimble.
- Post-peak decline by 2028.
Solar cycle 25 peak predictions sharpen our edge. No surprises when flares fly. Start tracking today. Your grid thanks you.
FAQs
When exactly will solar cycle 25 peak according to latest predictions?
Core window: July 2025, stretching to Q2 2026 based on NOAA revisions and recent surges.
Is solar cycle 25 stronger than predicted?
Yes—sunspot numbers exceed early forecasts, with events like the M5.7 flare signaling intensity.
How should USA residents prep for solar cycle 25 peak predictions?
Focus on grid backups, radio comms, and SWPC alerts—step-by-step plans cover it.