
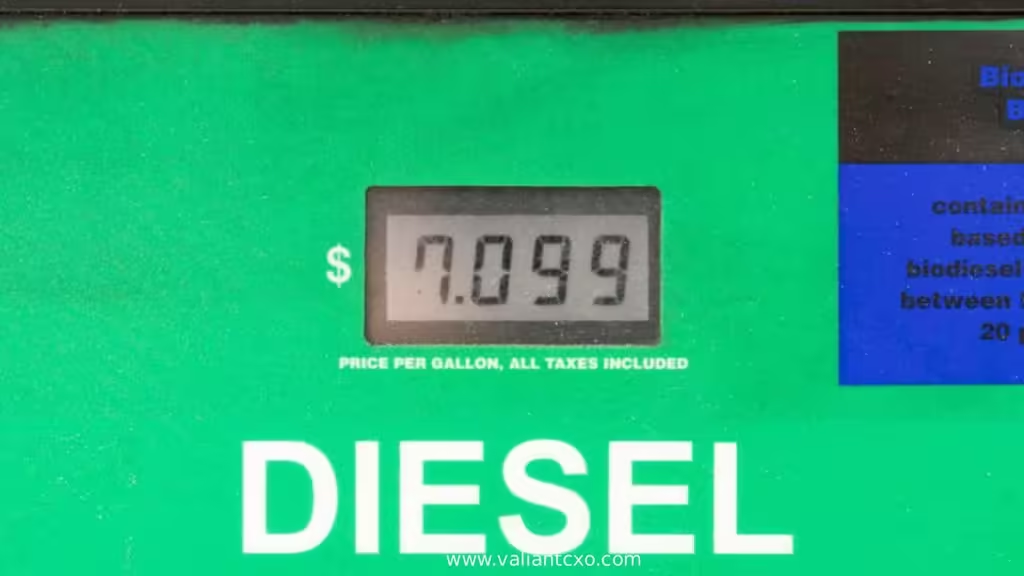
Diesel price trends and crack spreads explained the real story behind today’s high pump prices better than crude quotes ever could. Retail diesel sits near $6.35 a gallon nationally. The gap between what refiners pay for crude and what they sell diesel for has blown out to levels rarely seen outside true crisis periods. That gap—the crack spread—is where most of the pain (and the refining profit) lives right now.
- U.S. retail diesel averaged $6.35 per gallon in the latest EIA weekly survey, roughly $2.08 above regular gasoline and well above year-ago levels.
- Diesel crack spreads versus WTI have hovered in the $90–$100 per barrel range in recent weeks on the Gulf Coast and New York Harbor, with peaks even higher earlier in the fall.
- These elevated cracks stem directly from the same global refining capacity losses that define the latest global oil refining crisis and fuel shortages 2026.
- Distillate inventories remain about 10% below the five-year average, keeping pressure on prices.
- High cracks reward U.S. refiners running hard but leave truckers, farmers, and shippers carrying the cost.
Here’s the thing. Crude can be abundant and still leave diesel expensive if the machines that turn it into fuel are offline or maxed out.
What a diesel crack spread actually measures
A crack spread is the simple arithmetic of refining. Take the price of a barrel of ultra-low-sulfur diesel (ULSD), convert it from gallons, subtract the price of the crude oil that went into it, and you have the gross margin before operating costs, taxes, and distribution.
For New York Harbor, the calculation looks like this on a recent close: ULSD futures around $4.57 a gallon × 42 gallons = roughly $192 a barrel, minus Brent or WTI near $100–$110, producing a crack near $80–$95. Gulf Coast numbers have tracked even stronger in spots. These are not the $15–$30 cracks of quieter years. They are crisis-level spreads.
The 3-2-1 crack (two barrels of gasoline plus one of diesel from three barrels of crude) has also stayed elevated, but diesel itself has done most of the heavy lifting. Gasoline cracks remain far more modest. That imbalance is the clearest signal that the market is short middle distillates, not just short crude.
How diesel price trends evolved through 2026
Diesel Price Trends and Crack Spreads Explained Prices climbed steadily as refining outages mounted. By late summer and early fall, national averages pushed past $6 and flirted with record territory in some weeks. California has stayed the outlier, often above $8. The Gulf Coast, closer to export terminals and abundant domestic crude, has run cheaper but still elevated.
Year-over-year gains exceed $2.50 in many regions. The driver is not solely the crude price. A larger share of the retail increase comes from the refining margin itself. When global product supply tightens—as it has under the latest global oil refining crisis and fuel shortages 2026—cracks expand. Refiners with spare capacity or the ability to maximize diesel yield capture the upside. Everyone downstream pays it.
Inventories tell the same story. Distillate stocks sit roughly 10% under the five-year seasonal norm. Demand has not collapsed enough to offset the lost refining capacity from Russian drone damage and Middle East disruptions. Exports of U.S. diesel remain strong because the rest of the world is even tighter.
Crack spreads versus retail prices: a quick breakdown
| Component | Approximate contribution to $6.35 retail diesel | Notes |
|---|---|---|
| Crude oil cost | ~$2.70–$2.80 per gallon | Brent/WTI divided by 42 |
| Refining margin (crack) | ~$2.00–$2.20 per gallon | The elevated diesel crack |
| Distribution, retailer, state/local taxes | ~$1.10–$1.30 | Varies by region |
| Federal excise tax | $0.244 | Fixed |
| Total retail | ~$6.35 | National average |
Numbers move daily, but the split shows why focusing only on crude misses half the equation.
Practical steps for businesses watching diesel price trends and crack spreads
- Monitor the diesel crack daily alongside retail averages. Futures and EIA weekly data give early warning.
- Build fuel surcharges that reference both crude and a product benchmark rather than crude alone.
- Lock physical supply or hedge with ULSD futures when cracks look extended and inventories stay low.
- Review routes and idle time. At these prices every efficiency gain pays for itself quickly.
- Track regional differences. West Coast and California numbers often diverge sharply from Gulf Coast.
- Watch planned maintenance calendars for 2027. Deferred turnarounds could keep cracks supported longer than expected.
- If you control a fleet, test renewable diesel or biodiesel blends where logistics and warranties allow. They can sometimes soften pure petroleum exposure.
Diesel Price Trends and Crack Spreads Explained In my experience, the fleets that treat the crack as a leading indicator rather than a lagging one adjust faster and protect margins better.
Common mistakes when reading diesel price trends and crack spreads
Treating the retail price as a pure crude story. The refining margin has been the bigger variable in 2026. Fix: follow both legs of the crack.
diesel price trends and crack spreads explained Assuming high cracks mean unlimited refining capacity. U.S. plants are already running near multi-decade highs with little spare. Fix: remember utilization rates above 95% leave almost no cushion for outages.
Ignoring inventory data. Stocks below the five-year average keep the market one disruption away from another spike. Fix: check the weekly EIA distillate numbers every Wednesday.
Expecting cracks to normalize the moment crude softens. Product tightness can persist independently. Fix: watch export flows and global refining runs, not just WTI.
Diesel Price Trends and Crack Spreads Explained Overlooking regional basis risk. A national average hides large differences between PADD regions. Fix: price your specific lanes and terminals.
Key Takeaways
- Diesel price trends in late 2026 are driven more by refining margins than by crude alone.
- Crack spreads in the $90–$100+ per barrel range signal extreme middle-distillate tightness.
- These levels are a direct consequence of the capacity losses described in the latest global oil refining crisis and fuel shortages 2026.
- U.S. refiners benefit from the wide cracks while end-users absorb the cost in freight and operating expenses.
- Inventories remain lean, supporting elevated prices into 2027.
- Businesses that track both the crack and regional retail data make better hedging and surcharge decisions.
- Efficiency and alternative fuels become higher-ROI moves when the crack stays wide.
- Recovery depends on physical refining capacity returning, not just lower crude quotes.
Diesel Price Trends and Crack Spreads Explained Wide diesel cracks are the market’s way of shouting that product is scarce. Until more refining capacity comes back online, expect prices to stay sensitive to every new outage or demand surprise. Track the crack, manage the exposure, and treat fuel as the strategic input it has become.
FAQs
What does a high diesel crack spread tell you about current diesel price trends?
It shows that the cost of turning crude into diesel has risen sharply relative to the crude itself, usually because of tight product supply rather than expensive feedstock alone.
How are diesel price trends and crack spreads connected to the latest global oil refining crisis and fuel shortages 2026?
The crisis removed millions of barrels per day of refining capacity through damage and export limits, which directly expanded the crack and pushed retail diesel higher.
Can crack spreads stay elevated even if crude prices fall?
Yes. When product inventories are low and refining capacity is constrained, the margin can remain wide independently of the crude price.